Skip to content
Read what our customers say
Don't take our word for it. Read what our customers say on Gartner Peer Insights.
Join our 1-hour online demo to get a clear impression of how AlisQI could help you work smarter.

Need to convince stakeholders that you need a QMS? Want to test your quality management maturity?

Need to convince stakeholders that you need a QMS? Want to test your quality management maturity?
Read what our customers say

Don't take our word for it. Read what our customers say on Gartner Peer Insights.

Join our 1-hour online demo to get a clear impression of how AlisQI could help you work smarter.
off-spec-chart-1

SPC

Statistical Process Control to boost manufacturing performance

The modern manufacturing world demands efficiency and top-notch quality control to stay ahead of the competition.

As a key player in the manufacturing process – whether a manager, engineer, or analyst – you’re tasked with ensuring smooth and effective operations.

A powerful tool at your disposal is Statistical Process Control (SPC).

Think of yourself as a master conductor, leading a grand symphony of machines, processes, and workers in perfect harmony. One wrong note can send the whole symphony into disarray. Just as a conductor relies on sheet music to guide the musicians, SPC serves as the blueprint to keep your manufacturing operations on track.

This page will introduce you to SPC. You’ll explore how it can boost your performance, as well as diving into the benefits it can bring to your quality management processes.

What is Statistical Process Control?

How does it work?

Statistical Process Control, or SPC, is a method used to monitor, control, and optimize manufacturing processes by analyzing performance data. To get the most from SPC, you need to understand how it works.

SPC helps organizations to achieve process stability, reduce variability, and achieve a higher sigma level (a measure of process capability). SPC enables this by identifying and eliminating the root causes of defects.

In other words, the data-driven SPC approach allows you to identify and rectify potential issues before they turn into costly problems. This is a valuable advantage for any size of manufacturing business – including small to mid-sized enterprises.

With SPC, you can easily collect data from your production line, then use statistical tools to identify patterns, trends, and variations and make informed process improvement decisions.

Imagine this simple example. You run a factory producing widgets. You’ve set a standard for the ideal weight of each widget, but you notice that some widgets come out slightly heavier or lighter than desired.

Implementing SPC lets you collect data on the weights of your widgets and analyze it using statistical techniques. If you discover a trend or pattern that deviates from your standard, you can identify the cause and make process adjustments to ensure a more consistent, high-quality output.

When to use SPC for maximum impact

Statistical Process Control is a versatile method that can be applied in various situations to optimize your manufacturing goals. You should consider using SPC when you want to:

  • Enhance the quality and consistency of your products.
  • Pinpoint and eliminate the root causes of process variation.
  • Minimize waste and inefficiencies in your production line.
  • Make data-driven decisions to improve your processes.

Deciding how to use SPC relies on firstly categorizing your operations into different types of production – batch, process, and discrete manufacturing.
  • Batch manufacturing
  • Process manufacturing
  • Discrete manufacturing

Batch manufacturing

Batch manufacturing produces a fixed quantity of items in a single production run. SPC helps to monitor and control the quality of each batch, ensuring uniformity. 

During batch manufacturing, you can apply SPC by collecting data from each production run and comparing it to the established control limits. You measure key product characteristics and calculate control charts to determine if the process is stable and within the specified limits. 
For example, you can measure dimensions, weights, acidity, or other properties of a batch of products. If variations are detected, you can use root cause analysis to identify the source of the issue and implement corrective actions to bring the process back under control.

Process manufacturing

Process manufacturing involves mass-production, typically production of bulk goods. 

To apply SPC in process manufacturing, you'll need to continuously monitor the production process, often using automated sensors and data collection systems. This allows you to track critical process parameters, such as temperature, pressure, flow rate, or chemical composition. 
Analyzing the collected data using control charts helps you identify trends, patterns, or deviations within the process. If any are detected, you can take immediate corrective actions to maintain the desired product specifications and minimize waste.

Discrete manufacturing

Discrete manufacturing focuses on assembling unique or heavily customized products, such as electronics or automobiles. 

SPC ensures that individual components meet quality standards, resulting in a high-quality final product. SPC is applied by monitoring the quality of individual components and assemblies during the production process. This involves measuring key characteristics, such as dimensions, tolerances, and material properties, and comparing them to established control limits.

Applying SPC in various industries

Statistical Process Control can be applied across a wide range of industries, including food, pharmaceuticals, automotive, aerospace, and electronics. Here's how SPC can benefit some of the different verticals:

Food In the food industry, SPC ensures that products meet safety and quality standards, by reducing the risk of contamination, spoilage, or recall incidents.
Pharmaceuticals SPC plays a crucial role in maintaining quality control and compliance to regulations, ensuring that medicines are safe and effective.
Automotive Automotive – SPC helps to identify and rectify quality issues, such as ensuring that everything is produced within safety tolerances, thus reducing the risk of defects and limiting recalls.
Aerospace In the aerospace industry, SPC is vital for maintaining the highest level of quality control and safety, as even minor defects can have severe consequences.
Electronics SPC helps to maintain consistent quality in the production of electronic components, reducing the risk of defects and ensuring that products meet performance and reliability standards.

Many leading manufacturing companies, , have embraced SPC to improve their manufacturing processes, reduce costs, and enhance product quality. These companies understand the value of SPC and have integrated it into their operations as a core business strategy.

Democratizing SPC – empowering shop floor operators

While SPC has traditionally been the domain of specialists such as quality engineers and data analysts, it's essential to make SPC accessible to everyone involved in the manufacturing process, including shop floor operators. 

Providing everybody in your organization with the tools, training, and support they need to utilize SPC, empowers them to make data-driven decisions themselves. They’ll be able to identify and resolve issues in real-time and contribute to the overall success of your operations.

The best way to do this is by implementing Quality Management System (QMS) software such as AlisQI which includes powerful SPC analytics to help you control your data and share instant visualizations with people on the shop floor. 

SPC for manufacturing

Integrating SPC into your operations

As we navigate the complex world of manufacturing, it's crucial to understand how Statistical Process Control (SPC) fits into the larger framework of quality management.

From Total Quality Management (TQM) to Six Sigma, SPC has established itself as an integral component of these methodologies, seamlessly woven into the fabric of operations management.

Learn more about:

Exploring SPC charts, tools & techniques

To fully harness the power of Statistical Process Control (SPC), you should become well-versed in the various tools and techniques at your disposal. 

The following methods and techniques help you to transform raw data into actionable insights, enabling you to fine-tune your manufacturing processes and achieve unparalleled quality.

  • Box plot
  • Capability indices
  • Control charts
  • Pareto charts
  • X-bar and R-chart
  • Histograms
  • SPC rules
  • Process capability

Box plot

boxplots-to-evaluate-recipesA box plot is a graphical representation that provides a snapshot of data distribution. With a simple glance, you can assess central tendency, dispersion, and even potential outliers, making it an invaluable tool in your SPC arsenal.

Capability indices

Capability indices are metrics that offer a quantitative assessment of your process's ability to meet specified requirements. They help you gauge the effectiveness of your manufacturing operation and pinpoint areas for improvement. Here are some examples:

  • Cp (Process Capability Index)
    This index compares the allowable process spread to the actual process spread, determining whether the process is capable of meeting the required specifications.
  • Cpk (Process Capability Index – Adjusted)
    Cpk takes into account both the process mean and the process spread. It compares the process capability to the specification limits, providing insight into the process's ability to meet requirements while considering any potential mean shifts.
  • Pp (Process Performance Index)
    Pp is similar to Cp, but it measures the performance of a process over a longer period. This index is useful for evaluating the long-term capability of a manufacturing process.
  • Ppk (Process Performance Index – Adjusted)
    Ppk is the long-term equivalent of Cpk, which takes into account both the process mean and the process spread over an extended period.

Control charts

Control charts are the cornerstone of SPC, providing a visual representation of process stability over time. They plot data points collected from a process and compare them against predetermined control limits. These limits are typically based on the process's inherent variability and help to distinguish between common cause variation (natural fluctuations) and special cause variation (unusual events or problems).

Control Chart

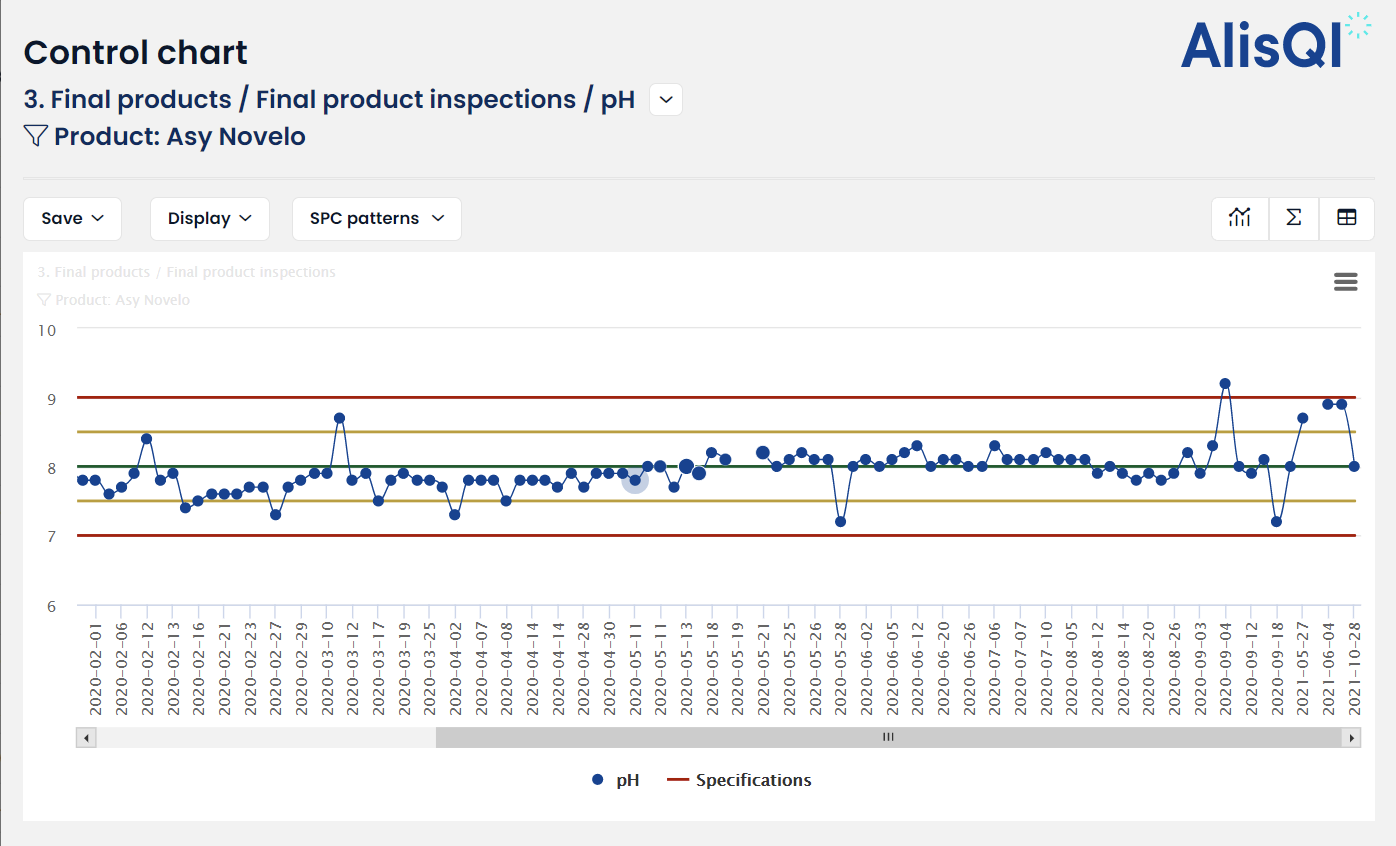
A real-life example of using control charts can be found in a bottling plant that fills containers with a specific volume of liquid. The objective is to ensure that the bottles are consistently filled with the correct volume, neither overfilled nor underfilled.

The plant regularly collects data from bottle samples and plots it on a control chart with average and control limits. If data points stay within limits, the process is stable and under control. If data points fall outside limits or show non-random patterns, special cause variation may need addressing.

In such cases, the plant investigates causes, like faulty filling machines or liquid viscosity changes, and takes corrective action. Regular control chart monitoring to spot patterns ensures a stable filling process, consistent quality, and minimized waste.

Pareto charts

A Pareto chart is a type of bar chart that displays the frequency of different causes or issues in descending order, allowing you to focus on the most significant problems first. This prioritization is based on the Pareto principle, which states that approximately 80% of the effects come from 20% of the causes.

Pareto Chart

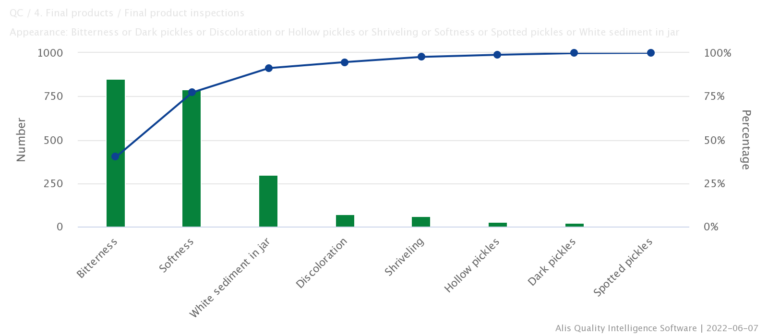
In a manufacturing plant, there may be multiple reasons for product defects. Collecting data on defect causes and representing them in a Pareto chart means that the plant can quickly identify the most common issues contributing to defects. 

For instance, if the Pareto chart reveals that machine misalignment is the leading cause of defects, the plant can prioritize addressing this issue to significantly reduce the overall defect rate.

X-bar and R-chart

In this section, we’ll explain the main differences between X-bar and R-chart diagrams.

x-chart & r-chart

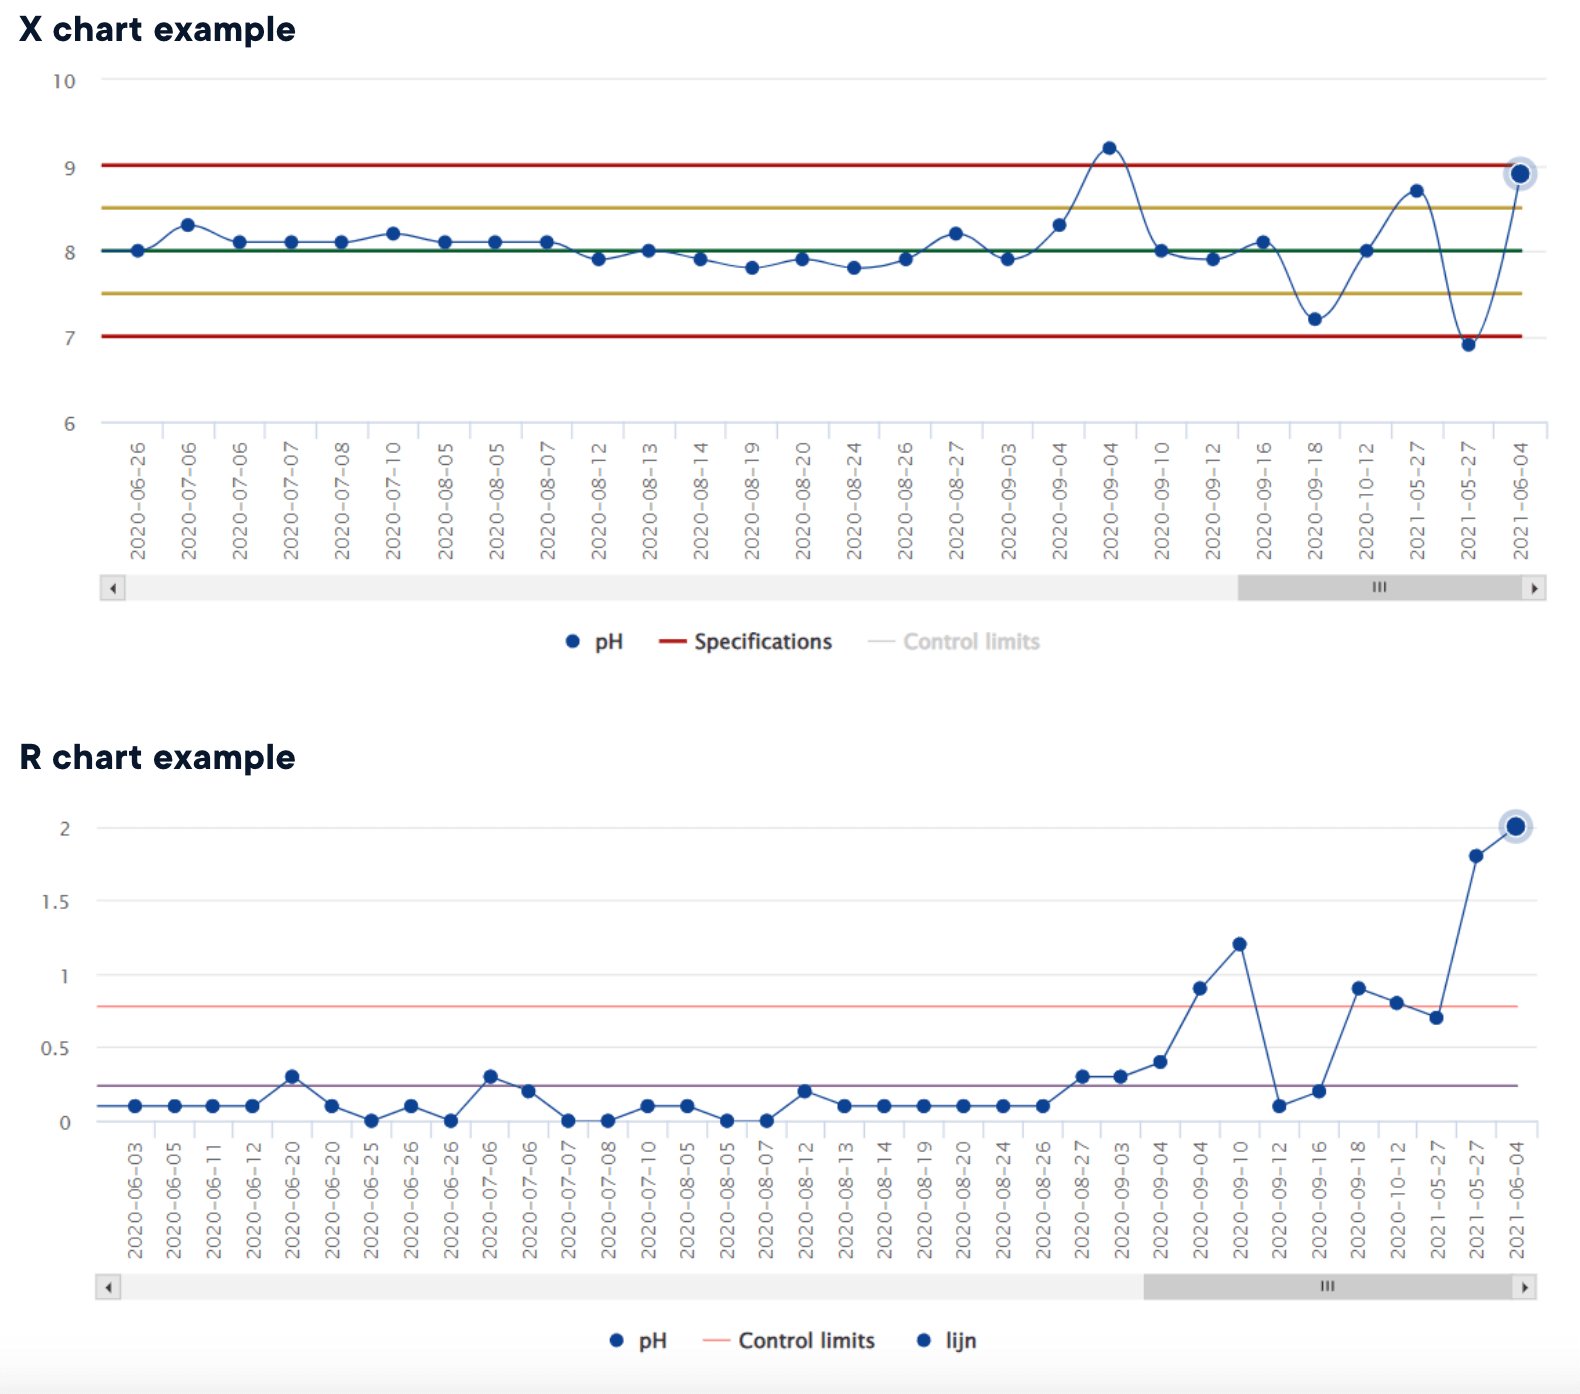
The X-bar chart displays the average (mean) of a sample, while the R-chart represents the range (the difference between the highest and lowest values) of the same sample. These two charts are used in tandem to monitor the central tendency and dispersion of a process, respectively.

For example, in a bakery, the weight of loaves of bread is an important quality characteristic. To ensure the loaves are consistently within the target weight range, the bakery can use X-bar and R-charts. 

The X-bar chart tracks the average weight of bread samples over time, while the R-chart monitors the variation within each sample. If the charts show that the process is drifting out of control, the bakery can investigate and address the root causes, such as inconsistent dough mixing or issues with the baking equipment.

Histograms

A histogram is a graphical representation of data distribution, using bars to display the frequency of data points within specific intervals. Analyzing histograms lets you assess the central tendency, dispersion, and shape of your process data, which can guide informed decision-making for process adjustments.

Histogram

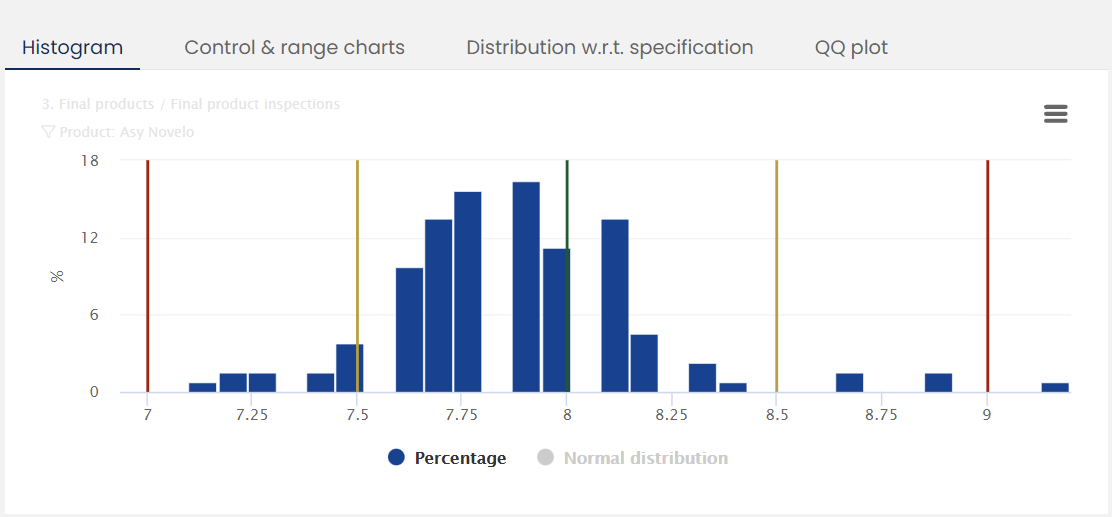
A factory producing plastic components might use a histogram to analyze the thickness of their products. Collecting thickness measurements and plotting them in a histogram allows the factory to visualize the data distribution clearly. If the histogram reveals a skewed or bimodal distribution, the factory can investigate potential causes, such as uneven cooling or variations in material composition, and make adjustments to achieve a more consistent product thickness.

SPC rules

SPC rules, also known as control chart rules, are guidelines used to detect unusual patterns or trends in control charts. 

These rules help to differentiate between common cause variation (inherent to the process) and special cause variation (resulting from external factors). 

Some common SPC rules include the detection of:

  • points outside the control limits,
  • consecutive points trending in one direction,
  • and a high number of points on one side of the centerline. 

When one or more SPC rules are violated, it is an indication that the process may be out of control, and further investigation is necessary to identify and address the root cause of the observed variation.

Process capability

Process capability is a key concept in SPC that quantifies the ability of a process to consistently meet predetermined specifications. 

It is typically measured using capability indices to compare the process spread and the allowable tolerance range. It takes into account the process centering within specified limits. 

Assessing process capability, organizations can determine if their manufacturing processes are capable of consistently producing products that meet quality standards. Additionally, monitoring process capability using SPC helps to identify areas where process improvements are needed, ultimately leading to more efficient operations and higher product quality.

SPC software

How to access the most advanced features

Effectively implementing SPC in manufacturing processes demands the use of appropriate and reliable tools for data analysis and visualization. There are various options available, ranging from simple spreadsheets to specialized SPC programs. In this section, we’ll discuss different SPC tooling options and how to implement them.

SPC with Excel

Everyone has used Microsoft Excel at some point in their lives. It is a widely accessible and easy-to-use tool that can be employed for basic SPC tasks. With built-in functions and charting capabilities, Excel allows you to create control charts, histograms, and Pareto charts. 

However, using Excel for SPC has a number of limitations, particularly in terms of real-time data monitoring, complex analysis, and scalability. It may also require manual data input and custom formula creation, which makes it prone to errors and time-consuming compared to other methods.

Dedicated SPC software

Dedicated SPC software provides more advanced features and automation compared to Excel, making it suitable for complex and large-scale operations. These software programs are specifically designed for SPC, offering real-time data monitoring, advanced statistical analysis, and customizable reporting. 

Using specialized SPC software provides manufacturers with more accurate analysis and efficient process monitoring, leading to better decision-making and improved quality control.

Best-of-breed SPC vs. integrated SPC

When selecting SPC tools, organizations have the option to choose between best-of-breed SPC solutions, which are standalone programs specifically designed for SPC, or integrated SPC, which is built into broader manufacturing or quality management systems (QMS).

Best-of-breed SPC solutions typically offer more advanced and specialized features but may require additional integration efforts with existing systems. 

On the other hand, integrated SPC solutions may provide seamless data flow and compatibility with other manufacturing processes but might lack some advanced SPC capabilities. AlisQI offers a fully-integrated SPC analytics tool that makes life much easier for quality managers and analysts.

How to implement SPC tools

Implementing SPC in a manufacturing environment involves several key steps. 

  1. Identify the critical processes and quality characteristics that need monitoring.
  2. Determine the appropriate data collection methods and sampling frequency. 
  3. Select the SPC tool that best fits your needs, whether it's Excel, dedicated SPC software, or an integrated solution. 
  4. Train relevant personnel on SPC concepts, tool usage, and interpretation of results.
  5. Establish a continuous improvement culture that encourages ongoing analysis and process optimization based on SPC insights.

Conclusion

Statistical Process Control (SPC) is an indispensable tool for success in the highly competitive manufacturing landscape. 

SPC offers the potential to enhance performance and provide numerous benefits in terms of quality management. 

Implementing SPC in your manufacturing operations will help you to reduce variability, optimize processes, and ultimately, achieve higher levels of efficiency and quality control. 

As a manager, engineer, or analyst, embracing SPC helps you stay ahead of the competition, as well as creating a culture of continuous improvement and innovation within your organization. 


So, take the leap and harness the power of SPC to drive success and maintain a competitive edge in the ever-evolving world of manufacturing.

Discover how AlisQI can help you to achieve quality success with SPC that is easy to use and available to everyone who needs it – book a demo today.

Let's plan a free demo!

We would love to show you how your factory can benefit from using our software, save up to 20% on time and reduce waste by up to 15%! Join our 1-hour online demo to get a clear impression of how AlisQI could help you work smarter.