Quality Control
Solvers help you monitor quality, apply SPC, manage equipment, and ensure traceability.

The holy grail for any manufacturing manager is a fully capable process. Meaning that your factory does what it should do: produce products your customers want to pay for. How to find out that you are capable and that the products fit your customers’ requirements? You can simply check every product after production, and hope for the best. But that doesn’t really sound like 2021. Luckily, we can stand on the shoulders of giants.
Cp, Cpk, Pp, and Ppk are parameters (indices) that act as indicators for process performance and capability. The single number in Cpk or Ppk tells you all about how capable your process is in actually delivering a quality product.
This article is a guide to process capability and capability indices. We’ll clarify the indices, their use, and interpretation, and highlight how smart QMS software makes your processes reliable.
Lean Six Sigma methodologies teach us that reducing variation in your processes will make the outcome of those processes (i.e., quality) more predictable. A process is considered stable if it maintains its average and standard deviation over time. Short-term stability is a good predictor of long-term behavior. Once you’ve ensured stability, you can use capability indices to deepen your understanding, identify if the process starts to drift and take more informed decisions regarding potential adjustments.
Cp and Cpk measure process capability. Cp assesses the process potential and whether the process spread is within the pre-defined specification limits. On the other hand, Cpk measures the actual capability of the process. The k represents the centralizing factor. Let’s illustrate the difference with a very simple example.
Imagine trying to fit a cake inside a box. The box represents the specs and our customer’s demands, while the cake is the process and its natural variation. If the cake is wider than the box, it won’t fit. If the cake is narrower than the box but not centered – it will likely hit the sides of the box. Hitting the sides of the box is equivalent to producing a defective part.

As you probably already guessed, this simple analogy is not meant to fuel your cravings. Instead, it tells us that we want manufacturing processes to be well-centered and within the specification limits.
Cp and Cpk are used with processes that are under statistical control. They are indicators of mature, stable processes.
In contrast, Pp and Ppk measure process performance. Pp monitors the spread of the process relative to its specification limits, while Ppk measures the process centering. So, what is the difference between Cp, Cpk, and Pp, Ppk? Pp and Ppk are used with new processes, that are not yet under statistical control. Here, you can think of a pre-production run with an initial setup. To analyze performance in a pre-production run, there is also a difference in how data is being collected (the whole population versus the sample deviation or deviation mean with Cp and Cpk).
To go back to our previous example, we only have a satisfied customer if the cake fits in the box. Then we are capable of delivering a quality product. But how capable are we?
If the cake only just fits the box, we can deliver it to the customer. However, we cannot afford any more variation, because then the cake would no longer fit the box. If we have plenty of margin in the box, we can of course deliver, and we will know that we also have margin for error. So, we can sleep tight.
This degree of margin is called process capability and is measured using capability indices. That is where the Cp(k)/Pp(k) family joins the table.
The more margin to your box, the better, as more margin allows for process variation without risking products you cannot sell.
When interpreting your capability indices, you might also be inspired by these standard classifications:

Still waiting for the part with math equations? Sure, we could list them. Some of you may (happily) start calculating. Doing the math one time is easy and won’t cost much time. However, the story changes completely when you need to do the math for 10 parameters within 200 products. Automation saves you this effort! Filling your specifications in AlisQI, you’ll cut back on time and eliminate the risk of taking the wrong decision.
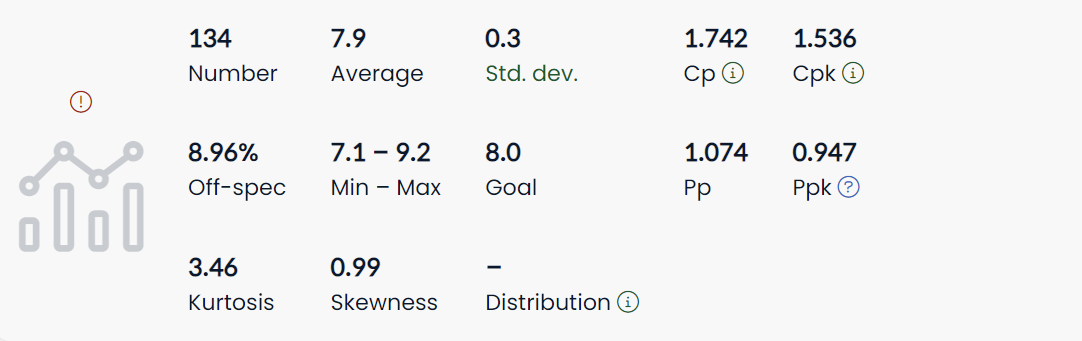
The data is analyzed in a matter of milliseconds and summarized into clear histograms, control charts, and other useful SPC tools that help with your decision-making.
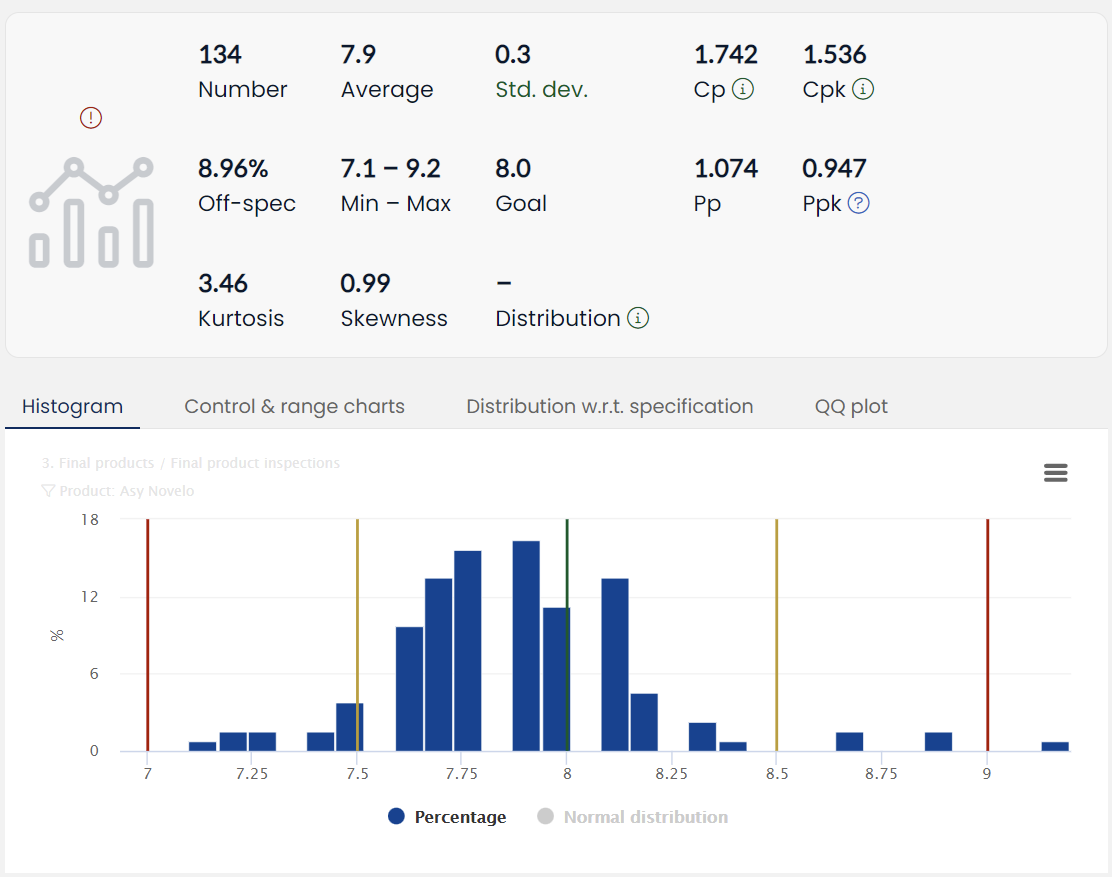
Is your process centered? Has it shifted? Is it too wide? No matter the case, everything will become crystal clear. Regardless of the amount of data in your analysis set, the calculation of Cp, Cpk, Pp, and Ppk is available with the push of a button. And, if you’re still worried about mixing up the four abbreviations or interpreting them, the smart system can help with suggestions.
All insights and overviews can be stored for quick reuse in dashboards or exported as pdfs. AlisQI enables you to easily and accurately monitor process behavior and make adjustments to keep things consistent.
Using smart automation, Cp, Cpk, Pp and Ppk will no longer be confusing, calculating and interpreting the indices will become business-as-usual – or better said – a piece of cake.
Cp, Cpk, Pp, and Ppk are parameters (indices) that can measure process variation and can help manufacturers to determine process performance and capability. Cp and Cpk are used with stable, mature processes that are under statistical control. In contrast, Pp and Ppk are useful when analyzing performance in a pre-production run or a new process that is not yet under statistical control.
AlisQI can help you to easily determine process performance and capability. The smart, intuitive system calculates the indices, creates visual snapshots, helping you establish process stability and to make informed decisions.
Want to see our product in action and learn more about SPC, capability, and process performance indicators? Schedule a demo and discuss your case to better understand the multiple ways in which your company could leverage AlisQI.